
xwMOOC 데이터 과학
xwMOOC
r Sys.Date()
1. 북한 미사일 발사
North Korea Missile, jjwkdl 블로그 등을 통해서 전세계적으로 북한 미사일 발사 사례가 관심을 모으고 있다. 특히, NTI: North Korea Tests Missile before key U.S.—China Summit 웹사이트에 북한 미사일 관련 다양하고 자세한 정보가 저장되어 있다.
2. 북한 미사일 데이터 분석
2.1. 데이터 다운로드
가장 먼저 Nuclear Threat Initiative 웹사이트에서 북한 미사일 관련 데이터를 다운로드 받아 저장한다.
# 0. 환경설정 ----------------------------------

library(tidyverse)
library(readxl)
library(stringr)
library(plotly)
library(leaflet)
library(hrbrthemes)
library(extrafont)
loadfonts()

# 1. 데이터 가져오기 ----------------------------------
## 1.1. 인터넷 데이터 다운로드 ------------------------
nk_missile_url <- "https://www.nti.org/documents/2137/north_korea_missile_test_database.xlsx"
destfile <- "data/north_korea_missile_test_database.xlsx"

download.file(nk_missile_url, destfile)
2.2. 데이터 가져오기
NTI 북한미사일 발사 데이터셋을 R로 불러와서 전처리 작업을 수행한다.
## 1.2. 데이터 불러오기 ------------------------

nk_dat <- read_excel("data/north_korea_missile_test_database.xlsx", sheet="Missile Tests", skip=1)

nk_dat %>% select(-`Additional Information`, -`Source(s)`) %>%
    DT::datatable()
# 2. 데이터 전처리 ----------------------------------
nk_df <- nk_dat %>% select(-`Additional Information`, -`Source(s)`) %>%
mutate(`Facility Latitude` = as.numeric(`Facility Latitude`),
`Facility Longitude` = as.numeric(`Facility Longitude`)) %>%
mutate(year = lubridate::ymd(paste0(lubridate::year(Date), "-01-01"))) %>%
mutate(`실험결과` = case_when(`Test Outcome` == "Success" ~ "성공",
`Test Outcome` == "Failure" ~ "실패",
`Test Outcome` == "Unknown" ~ "미상"))3. 북한 미사일 데이터 분석
미사일에 대한 자세한 정보는 NTI - North Korean Ballistic Missile Models 웹사이트를 참조한다.
- ICBM: Intercontinental Ballistic Missile (ICBM)
- IRBM: Intermediate-Range Ballistic Missile (IRBM)
- SLV: Ballistic/ Space Launch Vehicle
- SRBM: short-range ballistic missile (SRBM)
- MRBM: medium-range ballistic missile (MRBM)
- SLBM: submarine-launched ballistic missile (SLBM)
3.1. 미사일 발사 실험 결과 추세
연도별 북한 미사일 성공실패 추세를 미사일 발사실험 결과와 함께 살펴본다.
# 3. 시각화 ----------------------------------
## 3.1. 미사일 발사 실험 결과 추세 ----------------------------------

nk_df %>% group_by(year, 실험결과) %>%
    summarise(count = n()) %>%
    ggplot(aes(x=year, y=count, color=실험결과)) +
      geom_line(size=1) +
      theme_ipsum_rc(base_family="NanumGothic") +
      theme(legend.position = "top") +
      labs(x="", y="미사일 발사횟수", title="연도별 북한 미사일 성공실패 추세",
           color="미사일 발사시험 결과")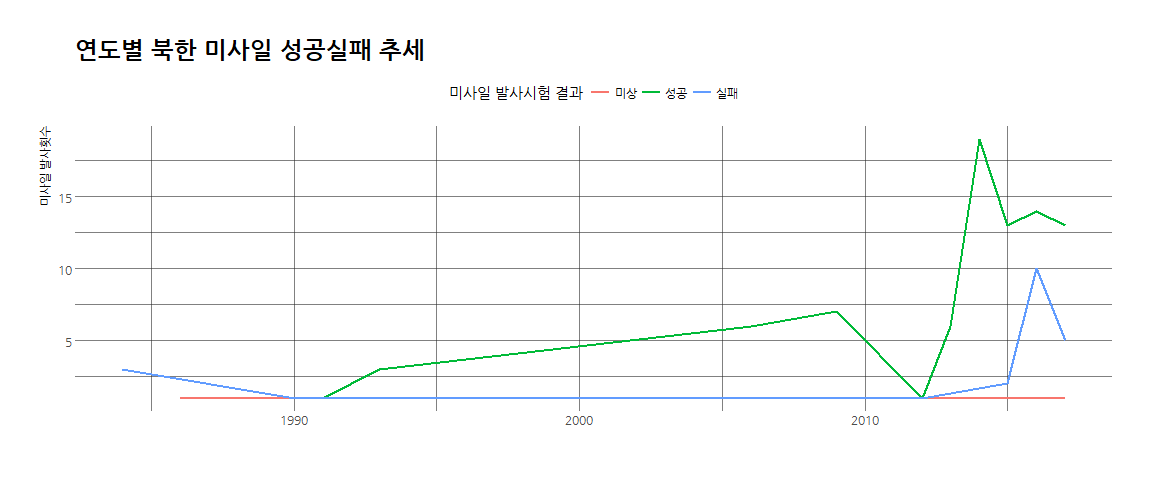
3.2. 미사일 유형별 실험 결과 추세
미사일 유형별 실험 결과를 살펴본다. 특히, 미사일 유형별 성공률을 DT를 활용하여 표로 인터랙티브 그래프로 시각화 한다.
## 3.2. 미사일 유형별 실험 결과 추세 ----------------------------------

nk_df %>% count(실험결과, `Missile Type`) %>%
    spread(실험결과, n, fill=0) %>%
    arrange(desc(성공)) %>%
    mutate(성공률 = scales::percent(성공 / (미상+성공+실패))) %>%
    DT::datatable()
nk_missile_gg <- nk_df %>% group_by(year, `Missile Type`) %>%
summarise(count = n()) %>%
rename(missile_type = `Missile Type`) %>%
ggplot(aes(x=year, y=count, color=missile_type, group=missile_type,
text = paste('연도 :', lubridate::year(year), "\n",
'미사일 유형:', missile_type, "\n",
'발사횟수: ', count))) +
geom_line(size=1) +
geom_point(size=1.5) +
theme_ipsum_rc(base_family="NanumGothic") +
theme(legend.position = "top") +
labs(x="", y="미사일 발사횟수", title="연도별 북한 미사일 유형별 발사 추세",
color="미사일 유형")
ggplotly(nk_missile_gg, tooltip = "text")3.3. 발사거리와 최대고도
미사일 최대고도와 발사거리 관계를 살펴본다.
## 3.3. 발사거리와 최대고도 ----------------------------------

nk_df <- nk_df %>%
    mutate(최대고도 = ifelse(Apogee =="Unknow", NA, str_replace(Apogee, " km", "")) %>% as.numeric) %>%
    mutate(비행거리 = ifelse(`Distance Travelled` =="N/A", NA, str_replace(`Distance Travelled`, " km", "")) %>% as.numeric)

nk_apogee_gg <- nk_df %>%
    ggplot(aes(x=최대고도, y=비행거리, color=`Missile Type`, group=`Missile Type`,
               text = paste('연도 :', lubridate::year(year), "\n",
                            '미사일 유형:', `Missile Type`, "\n",
                            '미사일 명칭:', `Missile Name`, "\n",
                            '발사위치:', `Facility Name`, "\n",
                            '실험결과:', `Test Outcome`, "\n"))) +
    geom_point(size=1.5) +
    theme_ipsum_rc(base_family="NanumGothic") +
    theme(legend.position = "top") +
    labs(x="최대고도(km)", y="비행거리(km)", title="북한 미사일 최대고도와 비행거리 비교",
         color="미사일 유형") +
    scale_y_continuous(labels = scales::comma) +
    scale_x_continuous(labels = scales::comma)

ggplotly(nk_apogee_gg, tooltip = "text")
4. 미사일 발사 위치
미사일 발사된 장소와 미사일 유형을 지리정보를 활용하여 시각화한다.
# 4. 지리정보 ----------------------------------

names(nk_df)
[1] "F1" "Date"
[3] "Date Entered/Updated" "Missile Name"
[5] "Missile Type" "Launch Agency/Authority"
[7] "Facility Name" "Facility Location"
[9] "Other Name" "Facility Latitude"
[11] "Facility Longitude" "Landing Location"
[13] "Apogee" "Distance Travelled"
[15] "Confirmation Status" "Test Outcome"
[17] "year" "실험결과"
[19] "최대고도" "비행거리"
leaflet(data = nk_df) %>%
addProviderTiles(providers$OpenStreetMap) %>%
addMarkers(lng=~`Facility Longitude`, lat=~`Facility Latitude`, clusterOptions = markerClusterOptions(),
popup = ~ as.character(paste0("<strong>", paste0("미사일명: ", `Missile Name`), "</strong><br><br>",
"-----------------------------------------------------------<br>",
"· 발사일자: ", `Date`, "<br>",
"· 미사일 유형: ", `Missile Type`, "<br>",
"· 발사 위치명: ", `Facility Name`, "<br>",
"· 실험결과: ", `Test Outcome`, "<br>"
)))