1 고대 그리스 수학1
고대 그리스 수학은 세가지 측면에서 큰 발전을 이뤘다. [1]
추상화(Abstraction): 수학의 추상화는 수학 개념의 기본 구조, 패턴 또는 속성을 추출하여 원래 연결된 실제 객체에 대한 의존성을 제거하고 더 넓게 적용하거나 다른 초록과 일치하도록 일반화하는 프로세스. 컴퓨터 과학에서는 복잡한 자료, 모듈, 시스템 등으로부터 핵심적인 개념 또는 기능을 간추려 내는 것.
연역적 추론(Deductive Reasoning): 이미 알고 있는 판단을 근거로 새로운 판단을 유도하는 추론이다. 여기서 이미 알고 있는 판단은 전제, 새로운 판단은 결론이다. 진리가 될 수 있는 가능성을 따지는 귀납 추론과는 달리, 명제들 간의 관계와 논리적 타당성을 따진다.
- 귀납적 추론(Inductive Reasoning): 개별적인 특수한 사실이나 현상에서 그러한 사례들이 포함되는 일반적인 결론을 이끌어내는 추론 형식의 추리 방법이다.
- 수학적 귀납법 (Mathematical induction): 모든 자연수가 어떤 주어진 성질을 만족시킨다는 명제를 증명하는 방법의 하나이다. 가장 작은 자연수가 그 성질을 만족시킴을 증명한 뒤, 만약 어떤 자연수가 만족시키면 바로 다음 자연수 역시 만족시킴을 증명하기만 하면, 모든 자연수에 대한 증명이 끝난다.
기하학(Geometry): 점, 선, 면 등 공간에 있는 공간에 있는 도형의 성질, 즉 대상들의 치수, 모양, 상대적 위치를 탐구하는 수학의 한 분야
1.1 수학적 귀납법
수학적 귀납법을 사용하여 자연수 홀수의 합이 \(n^2\)이 됨을 증명하자. 이를 수식으로 표현하면 다음과 같다.
\[1+3+...+(2n-1) = n^2, n \in N\] 상기 식을 증명하는데 수학적 귀납법을 사용한다.
1단계: 기본 사례
기본 사례(base case)를 증명한다. 즉, 1인 경우 성립하는지 확인한다.
\[1 = 1^2\]
따라서, \(1 = 1^2 = 1\)이 성립한다.
2단계: 귀납 가정
다음 단계로 귀납 가정(Inductive Hypothesis)을 상정한다. 즉, \(k\)에 대해 다음이 성립한다고 가정한다.
\[1+3+...+(2k-1) = k^2\]
3단계: 귀납 증명단계
마지막으로 \(k+1\)을 생각해보자.
\[(1+3+\cdots +(2k-1))+(2(k+1)-1) = (1+3+\cdots +(2k-1))+(2k+1)\] 상기 식을 정리하면 다음과 같다.
\[(1+3+\cdots +(2k-1))+(2k+1)=k^2+2k+1=(k+1)^2\] 따라서, 수학적 귀납법에 따라 모든 \(n\in \mathbb{N}\) 자연수에 대해 \(1+3+\cdots+(2n-1)=n^2\) 이 성립함을 증명했다.
1.2 기하학 증명
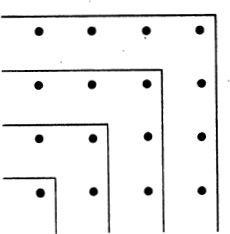
홀수의 합이 \(\text{홀수}^2\)이 되는 것은 다음과 같이 기하학적으로 확인할 수 있다.

1.3 재귀 함수
재귀 함수(recursion)를 사용해서 다음과 같이 앞선 수학적 귀납법을 프로그래밍 코드로 작성할 수 있다.
sum_of_odds_up_to_n <- function(n) {

  # 기본 사례
  if(n == 1) return(1)

  # 수학적 귀납법
  if(n != 1) return(sum_of_odds_up_to_n(n-1) + 2 * n - 1)

}

sum_of_odds_up_to_n(1)
[1] 1sum_of_odds_up_to_n(3)[1] 9sum_of_odds_up_to_n(9)[1] 812 피타고라스 정리2
피타고라스 정리(Pythagoras Theorem)는 직각 삼각형의 두 직각변 \(a,b\)를 각각 한 변으로 하는 정사각형 면적의 합은 빗변 \(c\)를 한 변으로 하는 정사각형의 면적과 같다는 정리다. 수식으로 표현하면 다음과 같다.
\[a^2 + b^2 = c^2\]
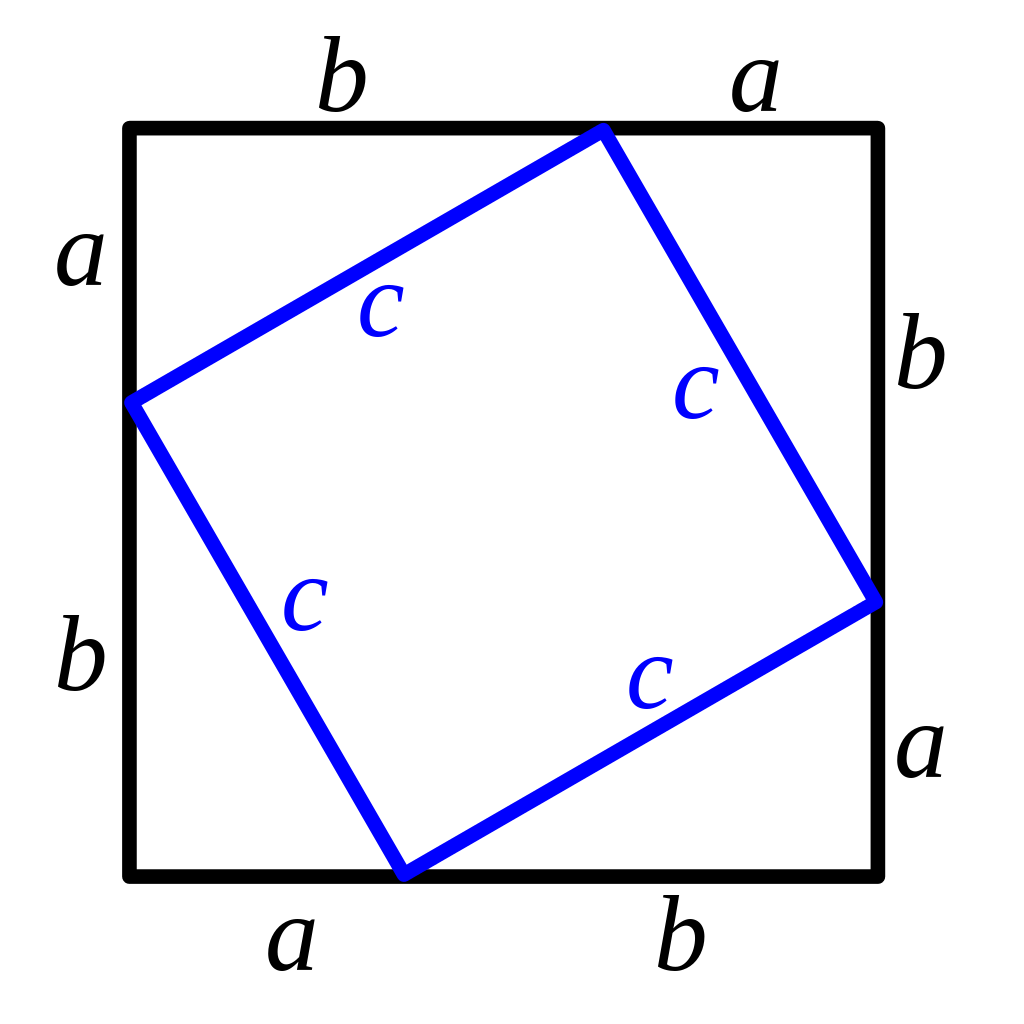
피타고라스 정리 증명은 수도 없이 많지만 위키에 나와 있는 유클리드 증명, 대수적 증명, 삼각형의 닮음을 통한 증명, 미국 대통령 가필드 증명 등이 있다. 여기서 대수적 증명을 살펴보자.

먼저 큰 정사각형을 생각해보자. 큰 정사각형 전체 면적은 다음과 같다.
\[(a+b) \times (a+b) = (a+b)^2\] 다음으로 4개의 작은 삼각형의 합과 내부 정사각형의 면적을 구해보자.
\[c^2 + 4\times \frac{1}{2} a b = c^2 + 2 a b\] 동일한 면적을 한번은 전체를 한번에 구하고, 두번째는 삼각형 4개와 정사각형 하나로 쪼개 구했기 때문에 두 면적은 같다. 이를 정리하면 피다고라스 정리를 구할 수 있다.
\[c^2 + 2 a b = (a+b)^2\] 상기 수식을 \(c^2\)에 대해 풀면 다음과 같다.
\[c^2 = (a+b)^2 - 2ab = a^2 + 2ab + b^2 - 2ab = a^2+b^2\]
2.1 GeoGebra
Pythagorean Theorem Proof #4를 참고한다.
2.2 ggplot
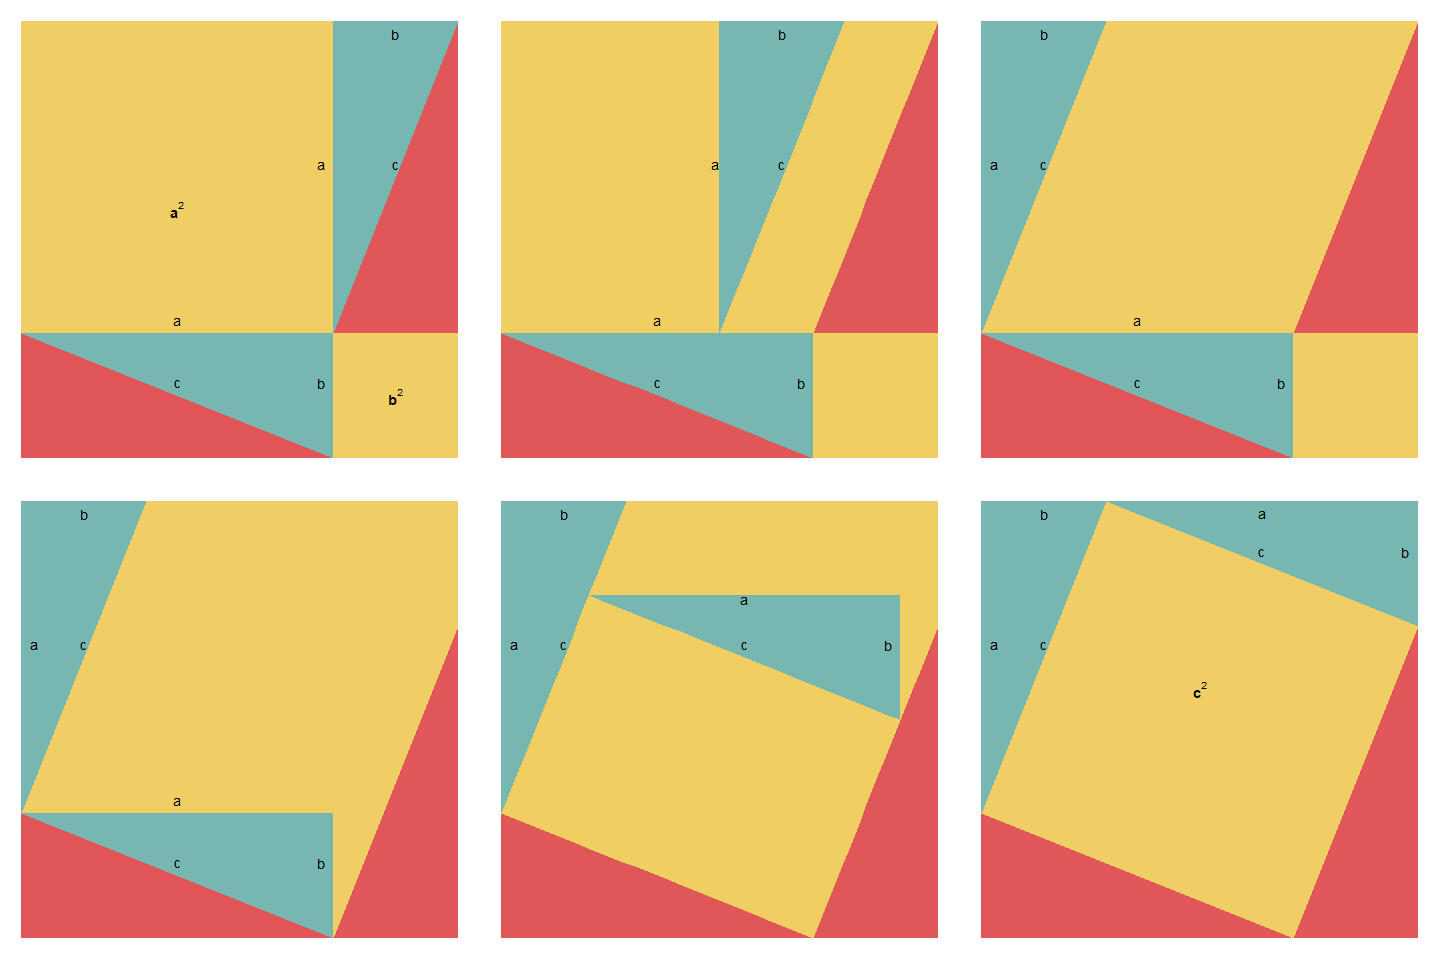
ggplot을 통해 피타고라스 정리를 애니메이션으로 구현도 가능하다. 자세한 사항은 notesofdabbler/learn_gganimate 웹사이트를 참고한다.

library(ggplot2)
library(gganimate)
library(ggthemes)
library(dplyr)
library(transformr)

df1 = tibble(x = c(0, 7, 7, 0), y = c(0, 0, 7, 7), type = "sq",
             xt = c(2.5, 6, NA, NA), yt = c(4, 1, NA, NA), lbl = c("bold(a^2)", "bold(b^2)",NA, NA))
df2 = tibble(x = c(0, 0, 5), y = c(0, 2, 0), type = "tr1")
df3 = tibble(x = c(0, 5, 5), y = c(2, 2, 0), type = "tr2",
             xt = c(2.5, 2.5, 4.8), yt = c(1.2, 2.2, 1.2), lbl = c("c", "a", "b"))
df4 = tibble(x = c(5, 7, 7), y = c(2, 2, 7), type = "tr3")
df5 = tibble(x = c(5, 5, 7), y = c(2, 7, 7), type = "tr4",
             xt = c(4.8, 6, 6), yt = c(4.7, 6.8, 4.7), lbl = c("a", "b", "c"))

df_a1 = bind_rows(df1, df2, df3, df4, df5) %>% mutate(state = "a1")

col_list = c("#F1CE63", "#E15759", "#76B7B2", "#E15759", "#76B7B2")
p = ggplot(df_a1) + geom_polygon(aes(x = x, y = y, group = type, fill = type))
p = p + geom_text(aes(x = xt, y = yt, label = lbl), parse = TRUE, size = 5)
p = p + scale_fill_manual(values = col_list) + guides(fill = FALSE)
p = p + theme_void()
p

#' The dataframe for the second state
#' and the associated plot is shown below
#'
#+
# State - a2
df1_a = tibble(x = c(0, 7, 7, 0), y = c(0, 0, 7, 7), type = "sq")
df5_a = tibble(x = c(0, 0, 2), y = c(2, 7, 7), type = "tr4",
               xt = c(0.2, 1, 1), yt = c(4.7, 6.8, 4.7), lbl = c("a", "b", "c"))
df_a2 = bind_rows(df1_a, df2, df3, df4, df5_a) %>% mutate(state = "a2")


p = ggplot(df_a2) + geom_polygon(aes(x = x, y = y, group = type, fill = type))
p = p + geom_text(aes(x = xt, y = yt, label = lbl), parse = TRUE, size = 5)
p = p + scale_fill_manual(values = col_list) + guides(fill = FALSE)
p = p + theme_void()
p

#' The dataframe for the third state
#' and the associated plot is shown below
#'
#+
# state - a3
df4_a = tibble(x = c(5, 7, 7), y = c(0, 0, 5), type = "tr3")
df_a3 = bind_rows(df1_a, df2, df3, df4_a, df5_a) %>% mutate(state = "a3")

p = ggplot(df_a3) + geom_polygon(aes(x = x, y = y, group = type, fill = type))
p = p + geom_text(aes(x = xt, y = yt, label = lbl), parse = TRUE, size = 5)
p = p + scale_fill_manual(values = col_list) + guides(fill = FALSE)
p = p + theme_void()
p

#' The dataframe for the fourth state
#' and the associated plot is shown below
#'
#+
# state - a4
df1_b = tibble(x = c(0, 7, 7, 0), y = c(0, 0, 7, 7), type = "sq",
               xt = c(3.5, NA, NA, NA), yt = c(4, NA, NA, NA), lbl = c("bold(c^2)", NA ,NA, NA))
df3_a = tibble(x = c(2, 7, 7), y = c(7, 7, 5), type = "tr2",
               xt = c(4.5, 4.5, 6.8), yt = c(6.2, 6.8, 6.2), lbl = c("c", "a", "b"))
df_a4 = bind_rows(df1_b, df2, df3_a, df4_a, df5_a) %>% mutate(state = "a4")

p = ggplot(df_a4) + geom_polygon(aes(x = x, y = y, group = type, fill = type))
p = p + geom_text(aes(x = xt, y = yt, label = lbl), parse = TRUE, size = 5)
p = p + scale_fill_manual(values = col_list) + guides(fill = FALSE)
p = p + theme_void()
p

#' Now the dataframes for the 4 states are combined into a single dataframe
#' and gganimate is used to transition between states to construct the animation

#+
# combining the dataframe into a single dataframe for animation
df = bind_rows(df_a1, df_a2, df_a3, df_a4)

p = ggplot(df) + geom_polygon(aes(x = x, y = y, group = type, fill = type))
p = p + geom_text(aes(x = xt, y = yt, label = lbl), parse = TRUE, size = 5)
p = p + scale_fill_manual(values = col_list) + guides(fill = FALSE)
p = p + theme_void()

anim = p + transition_states(state, transition_length = 1, state_length = 2, wrap = FALSE)
animate(anim, renderer = gifski_renderer("figures/pythagoras_theorem.gif"))
3 반증법: \(\sqrt{2}\) 무리수
반증법(proof by contradition) 혹은 귀류법은 간접증명법으로 어떤 주장에 대해 그 함의하는 내용을 따라가다보면 이치에 닿지 않는 내용 또는 결론에 이르게 된다는 것을 보여서 그 주장이 잘못된 것임을 보이는 것이다.
\(x^2 = 2\), 즉 \(x = \sqrt{2}\)가 유리수가 아닌 무리수임을 증명하자.
- \(x\) 가 유리수라고 가정한다. 즉, \(x = \frac{p}{q}\) 로 둔다. 여기서 \(p, q\)는 서로 서로소인 자연수라서 최대공약수가 1 이다. 이를 \(gcd(p,q) = 1\)이라고 한다.
- 유리수로 가정했기 때문에 \(\sqrt{2} = \frac{p}{q}\) 이 성립하고 양변을 제곱하면 \(2 = \frac{p^2}{q^2}\) 이 된다. 따라서, \(2q^2 = p^2\)이 되어 \(p\)는 2의 배수 짝수가 된다.
- \(p\)가 2의 배수 짝수이기 때문에 \(p = 2k\)와 같이 표현할 수 있다. 이를 통해 \((2k)^2 = 2q^2\)이 되고 이를 \(q\)에 대해 정리하면 \(q^2 = 2 k^2\)이 된다. 즉, \(q\)도 2의 배수 짝수가 된다.
- 하지만, \(p, g\)는 서로소이기 때문에 서로 공약수를 갖고 있지 않다고 했지만, \(p, g\)는 최소 2를 공약수로 갖는 관계가 성립되어 모순이 발생되어 \(x^2 = 2\), 즉 \(x = \sqrt{2}\)는 유리수가 되지 못한다.
4 자와 콤파스
고대 그리스는 직선을 긎는 자와 원을 그리는 콤파스를 활용해서 기본적인 연산과 제곱근을 도형을 활용해서 제작할 수 있었다.
4.1 덧셈
즉, 선분 AB = 3, 선분 CD = 2 이것을 더했을 때 선분 AB + 선분 CD = 선분 EF 가 된다.
\(\overline{AB} + \overline{CD} = \overline{EF}\) \(2 + 3 = 5\)
4.2 곱셈
삼각형을 이용한 곱셈과 나눗셈은 다음과 같다.
- 한변의 길이가 1인 삼각형을 그린다.
- 다른 한변과 평행한 선을 갖는 삼각형을 쭉 늘린다.
- 삼각형의 성질을 이용하여 다음과 같이 \(x\)를 구할 수 있다.
\[\frac{p}{1} = \frac{x}{q}\] \[x = p \times q\]
4.3 제곱근
자와 콤파스를 이용하여 제곱근도 구할 수 있다.
- 길이 1을 갖는 직선을 그린다.
- \(p\) 까지 길이를 늘린다.
- \(p\)까지 늘린 반지름을 갖는 반원을 그린다.
- 길이 1인 직선에서 직각을 이루는 선분을 반원에 닿는 곳까지 연결하고 연결하여 삼각형을 완성한다.
\[\frac{1}{x} = \frac{x}{p}\] \[x = \sqrt{p}\]
1. Hollingdale S. Makers of mathematics. Courier Corporation; 2006.
데이터 과학자 이광춘 저작
kwangchun.lee.7@gmail.com