RStudio Trainer Program
Tidyverse: Visualization - Lecture Note
xwMOOC
Tidyverse Korea2019-10-05
1 Lecture Note
- Static plot -
ggplot- Interactive plot -
plotly - Animation -
gganimate
- Interactive plot -
- Static plot -
ggplot- Small Multiple -
facet_* - Small Interactive Many -
trelliscopeJS
- Small Multiple -
2 Static plot - ggplot
2.1 Dataset - gapminder
Identify the target variable from gapminder dataset.
2.2 Visualize
Select one country and visualize lifeExp trend over year.
gapminder %>%
  filter(str_detect(country, "Korea, Rep")) %>%
  ggplot(aes(x=year, y=lifeExp)) +
    geom_line() +
    geom_point()
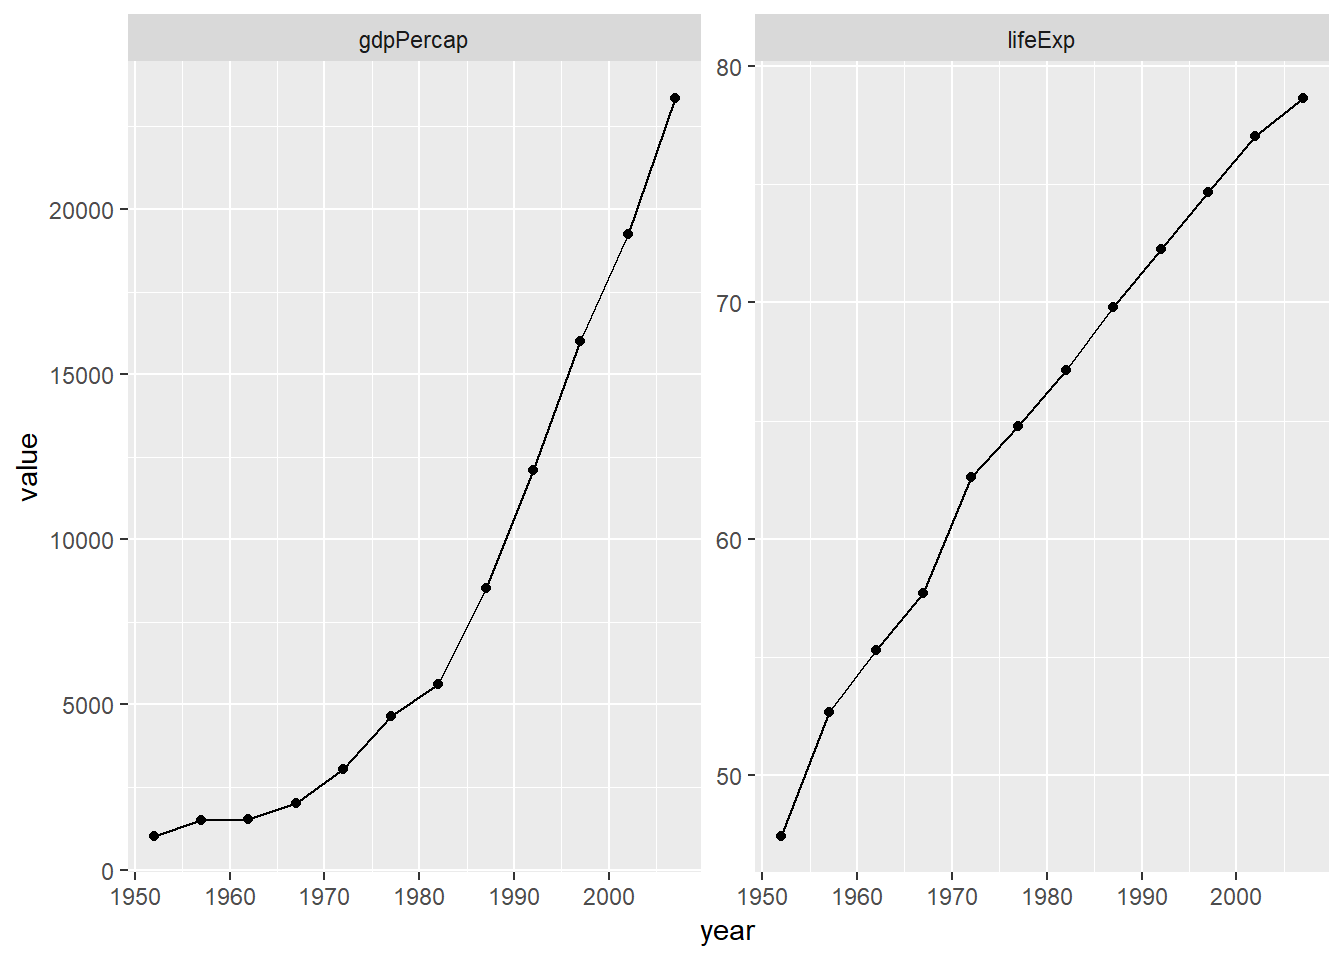
Compare lifeExp with gdpPercap over year.
gapminder %>%
  filter(str_detect(country, "Korea, Rep")) %>%
  select(year, lifeExp, gdpPercap) %>%
  gather(variable, value, -year) %>%
  ggplot(aes(x=year, y=value)) +
    geom_line() +
    geom_point() +
    facet_wrap(~variable, scale="free")
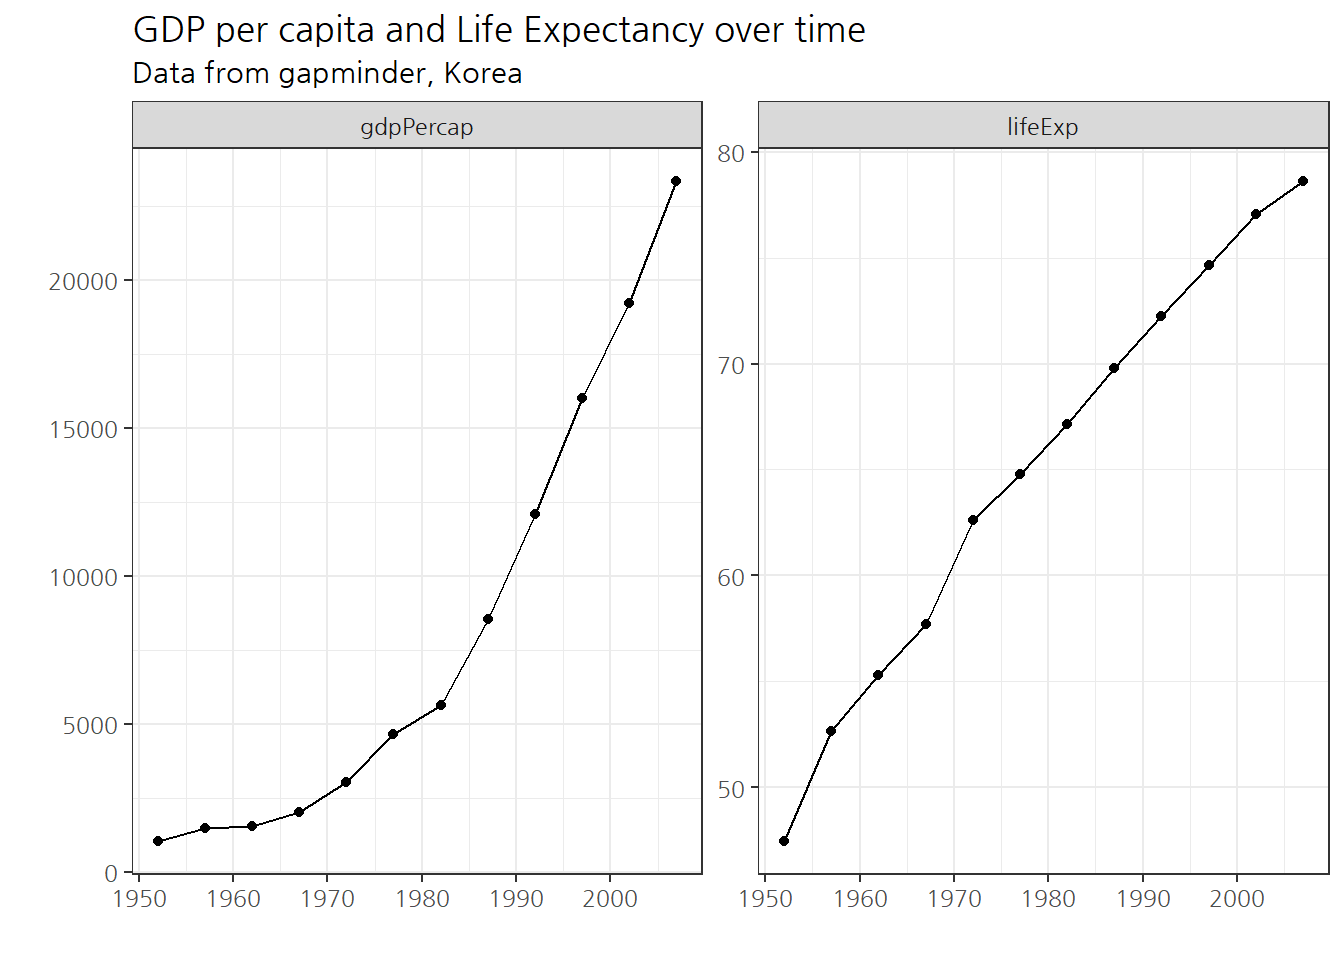
Decorate through adding labels, title, and applying a theme.
library(extrafont)
loadfonts()

gapminder %>%
  filter(str_detect(country, "Korea, Rep")) %>%
  select(year, lifeExp, gdpPercap) %>%
  gather(variable, value, -year) %>%
  ggplot(aes(x=year, y=value)) +
    geom_line() +
    geom_point() +
    facet_wrap(~variable, scale="free") +
    labs(x="", y="",
         title="GDP per capita and Life Expectancy over time",
         subtitle="Data from gapminder, Korea") +
    theme_bw(base_family = "NanumGothic")
3 Interactive plot - plotly
life_p <- gapminder %>%
    ggplot(aes(x=year, y=lifeExp, group=country)) +
    geom_line()

library(plotly)
ggplotly(life_p)
3.1 tooltip
3.2 Highlight
lifeExp_highlight <- highlight_key(gapminder, ~country)

highlight_p <- lifeExp_highlight %>%
     ggplot(aes(x=year, y=lifeExp,
                group=country,
                text=paste0("Continent: ", continent, "\n",
                            "Country: ", country, "\n",
                            "Life Expectancy: ", lifeExp))) +
     geom_line()

highlight_gg <- ggplotly(highlight_p, tooltip = "text")

highlight(highlight_gg, on = "plotly_click",
          selectize = TRUE,
          dynamic = TRUE,
persistent = TRUE)4 Animation
life_g <- gapminder %>%
  ggplot(aes(x=gdpPercap, y=lifeExp, group=country, color=country,
             text=paste0("Continent: ", continent, "\n",
                         "Country: ", country, "\n",
                         "Life Expectancy: ", lifeExp))) +
    geom_point(aes(frame=year), color="red") +
    geom_point(alpha=0.2) +
    facet_wrap(~continent, ncol=2) +
    scale_x_sqrt() +
    theme(legend.position = "none")

ggplotly(life_g, tooltip = "text")
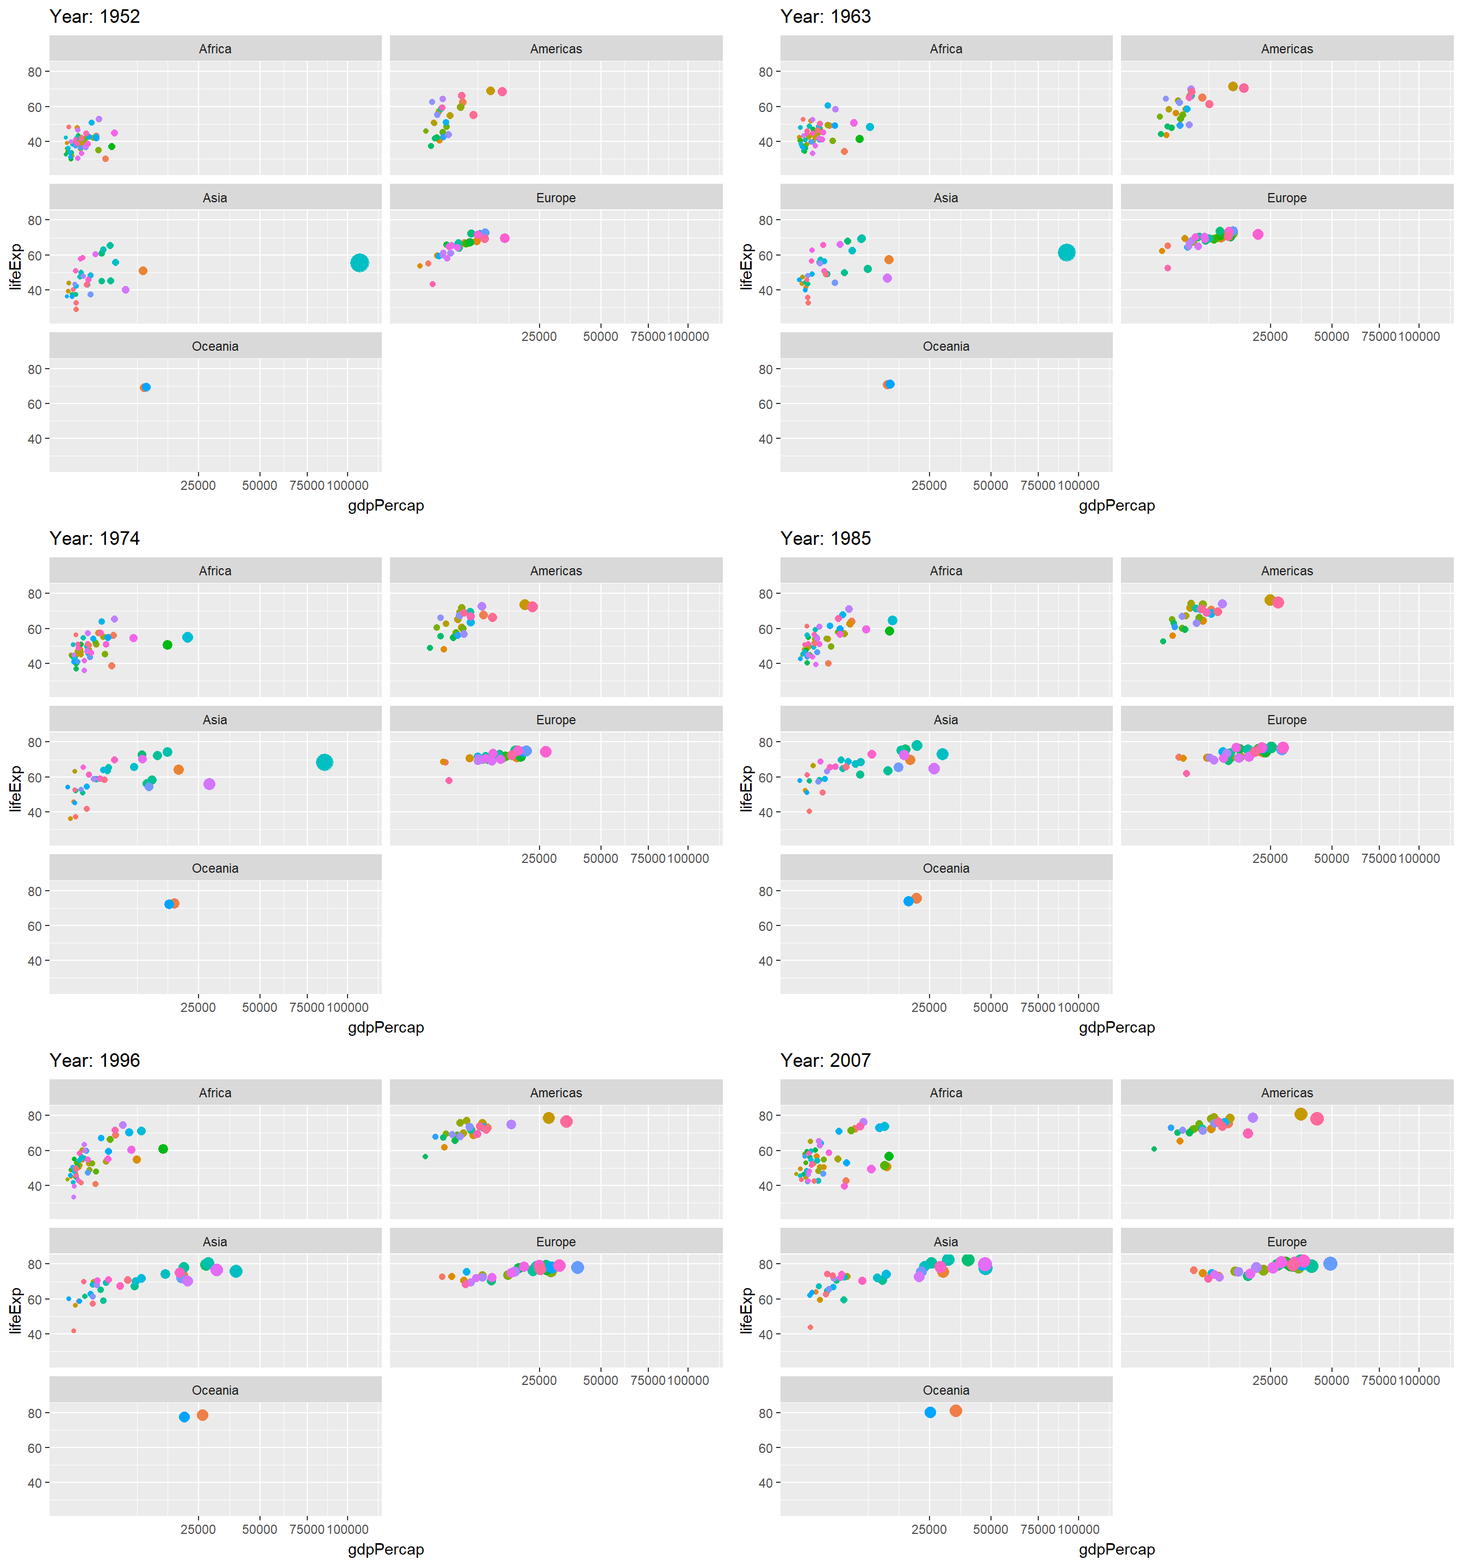
4.1 gganimate transition_time()
library(gganimate)
gapminder %>%
  ggplot(aes(x=gdpPercap, y=lifeExp, group=country, color=country,
             text=paste0("Continent: ", continent, "\n",
                         "Country: ", country, "\n",
                         "Life Expectancy: ", lifeExp))) +
    geom_point(aes(size=gdpPercap)) +
    facet_wrap(~continent, ncol=2) +
    scale_x_sqrt() +
    theme(legend.position = "none") +
    transition_time(year) +
    labs(title = "Year: {frame_time}")
5 Small Multiples
# A tibble: 5 x 3
  continent  year     n
  <fct>     <int> <int>
1 Africa     2007    52
2 Americas   2007    25
3 Asia       2007    33
4 Europe     2007    30
5 Oceania    2007     2
gapminder %>%
filter(continent %in% "Americas") %>%
ggplot(aes(x=year, y=lifeExp, group=country, color=country)) +
geom_point(aes(size=gdpPercap)) +
geom_line() +
facet_wrap(~country, ncol=2) +
scale_x_sqrt() +
theme(legend.position = "none") 
6 Small Many - trelliscopeJS
library(trelliscopejs)

## list-column dataset
gapminder_nest <- gapminder %>%
  filter(continent == "Americas") %>%
  group_by(continent, country) %>%
  nest()

## plotly graph function
lifeExp_plot <- function(df) {
    plot_ly(df, x = ~year, y = ~lifeExp) %>%
    add_markers() %>%
    add_lines()
}

## Generate trelliscopeJS interactive graph
gapminder_plot_df <- gapminder_nest %>%
  mutate(panel = map_plot(data, lifeExp_plot))

trelliscope(gapminder_plot_df,
            name = "gapminder", nrow = 2, ncol = 3,
            state = list(labels = c("continent", "country", "lifeExp")),
            path="gapminder_lifeExp")