1 shiny와 scikit-learng 만남
풀고자하는 문제는 가능하면 적은 시간과 노력으로 데이터 과학 해결책을 제시하는 것이다. 몇가지 방식이 있지만, 여기서는 펭귄 성별예측문제를 shiny 웹앱으로 서비스를 제공하는데 펭귄 성별 예측모델은 tidymodels가 아니라 scikit-learn으로 구축한 것을 사용한다. 이러한 접근법은 딥러닝 모형으로 예측모형 서비스를 만들고 빠른 시간내에 MVP 제품을 제작할 경우 큰 효과를 발휘할 수 있다.

2 파이썬 예측모형1
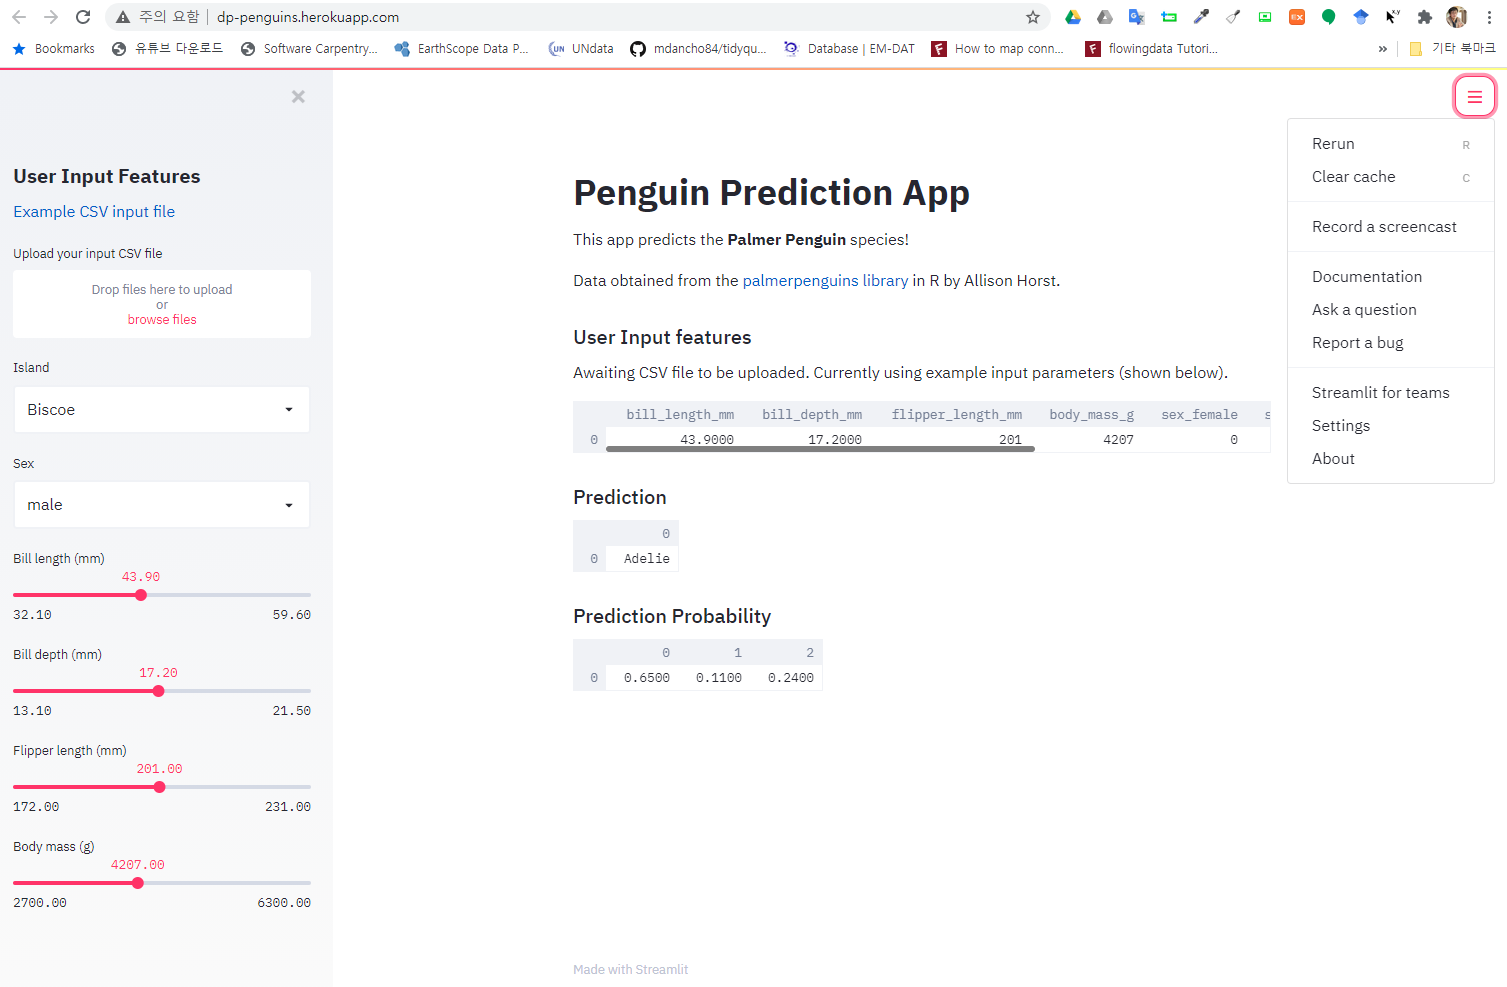
Chanin Nantasenamat (Jul 16 2020), “How to Build a Data Science Web App in Python (Penguin Classifier) - Part 3: ML-Powered Web App in a Little Over 100 Lines of Code” 사례는 shiny 대신 streamlit을 사용해서 데이터앱(Data App)을 빠르게 개발한 사례가 있다.
2.2 데이터
penguins_cleaned.csv 데이터를 GitHub에서 받아 로컬 파일로 저장시킨다.
library(tidyverse)

download.file(url = "https://raw.githubusercontent.com/dataprofessor/data/master/penguins_cleaned.csv", destfile = "data/penguins_cleaned.csv")

penguin_df <- readr::read_csv("data/penguins_cleaned.csv")

penguin_df
# A tibble: 333 x 7
species island bill_length_mm bill_depth_mm flipper_length_… body_mass_g
<chr> <chr> <dbl> <dbl> <dbl> <dbl>
1 Adelie Torge… 39.1 18.7 181 3750
2 Adelie Torge… 39.5 17.4 186 3800
3 Adelie Torge… 40.3 18 195 3250
4 Adelie Torge… 36.7 19.3 193 3450
5 Adelie Torge… 39.3 20.6 190 3650
6 Adelie Torge… 38.9 17.8 181 3625
7 Adelie Torge… 39.2 19.6 195 4675
8 Adelie Torge… 41.1 17.6 182 3200
9 Adelie Torge… 38.6 21.2 191 3800
10 Adelie Torge… 34.6 21.1 198 4400
# … with 323 more rows, and 1 more variable: sex <chr>2.3 모형 개발
파이썬 판다스와 sklearn Random Forest 모형을 이용하여 펭귄 성별을 예측하는 모형을 제작한다. 그리고 나서 예측모형을 피클(.pkl) 파일로 떨어 뜨린다.
import pandas as pd
penguins = pd.read_csv('data/penguins_cleaned.csv')

penguins_df = penguins[['bill_length_mm', 'bill_depth_mm', 'flipper_length_mm', 'body_mass_g', 'sex']]

# Ordinal feature encoding
# https://www.kaggle.com/pratik1120/penguin-dataset-eda-classification-and-clustering
df = penguins_df.copy()
target = 'sex'
# encode = ['species','island']
#
# for col in encode:
#     dummy = pd.get_dummies(df[col], prefix=col)
#     df = pd.concat([df,dummy], axis=1)
#     del df[col]

target_mapper = {'male':0, 'female':1}
def target_encode(val):
    return target_mapper[val]

df[target] = df[target].apply(target_encode)

# Separating X and Y
X = df.drop(target, axis=1)
Y = df[target]

# Build random forest model
from sklearn.ensemble import RandomForestClassifier
clf = RandomForestClassifier()
clf.fit(X, Y)

# Saving the model
RandomForestClassifier(bootstrap=True, class_weight=None, criterion='gini',
max_depth=None, max_features='auto', max_leaf_nodes=None,
min_impurity_decrease=0.0, min_impurity_split=None,
min_samples_leaf=1, min_samples_split=2,
min_weight_fraction_leaf=0.0, n_estimators=10,
n_jobs=None, oob_score=False, random_state=None,
verbose=0, warm_start=False)
/Users/kwangchunlee/Library/r-miniconda/envs/r-reticulate/lib/python3.6/site-packages/sklearn/ensemble/forest.py:245: FutureWarning: The default value of n_estimators will change from 10 in version 0.20 to 100 in 0.22.
"10 in version 0.20 to 100 in 0.22.", FutureWarning)3 R 환경에서 테스트
파이썬 예측모형이 담긴 피클 파일을 R 환경으로 불러온다. 이를 위해서 read_pickle.py 파일에 helper function을 작성하여 이를 함수로 불러올 수 있도록 한다.
import pandas as pd

def read_pickle_file(file):
    pickle_data = pd.read_pickle(file)
    return pickle_data
파이썬 예측모형 R 환경으로 불러오는 방법은 다음과 같다.
library(reticulate)

source_python("code/read_pickle.py")
penguin_clf <- read_pickle_file("data/penguins_clf.pkl")

penguin_clf
RandomForestClassifier(bootstrap=True, class_weight=None, criterion='gini',
max_depth=None, max_features='auto', max_leaf_nodes=None,
min_impurity_decrease=0.0, min_impurity_split=None,
min_samples_leaf=1, min_samples_split=2,
min_weight_fraction_leaf=0.0, n_estimators=10,
n_jobs=None, oob_score=False, random_state=None,
verbose=0, warm_start=False)3.1 R 데이터프레임 예측
먼저 예측에 사용될 펭귄을 데이터프레임으로 추출한다. 그리고 파이썬 성별예측 모형을 R로 불러와서 predict()에 넣어 성별을 예측한다. predict_proba()에 넣게 되면 숫컷, 암컷 펭귄 확률도 확인이 가능하다.
unkonwn_penguin <- penguin_df %>%
  select(bill_length_mm, bill_depth_mm, flipper_length_mm, body_mass_g) %>%
  slice(1:10)
  # sample_n(10)

unkonwn_penguin
# A tibble: 10 x 4
bill_length_mm bill_depth_mm flipper_length_mm body_mass_g
<dbl> <dbl> <dbl> <dbl>
1 39.1 18.7 181 3750
2 39.5 17.4 186 3800
3 40.3 18 195 3250
4 36.7 19.3 193 3450
5 39.3 20.6 190 3650
6 38.9 17.8 181 3625
7 39.2 19.6 195 4675
8 41.1 17.6 182 3200
9 38.6 21.2 191 3800
10 34.6 21.1 198 4400penguin_clf$predict(unkonwn_penguin) %>%
bind_cols(unkonwn_penguin) %>%
bind_cols(penguin_clf$predict_proba(unkonwn_penguin)) %>%
rename(pred_sex = `...1`) %>%
mutate(pred_sex = ifelse(pred_sex == 0, 'male', 'female')) %>%
bind_cols(penguin_df$sex[1:10])# A tibble: 10 x 7
pred_sex bill_length_mm bill_depth_mm flipper_length_… body_mass_g ...6[,1]
<chr> <dbl> <dbl> <dbl> <dbl> <dbl>
1 male 39.1 18.7 181 3750 1
2 female 39.5 17.4 186 3800 0.1
3 female 40.3 18 195 3250 0.3
4 female 36.7 19.3 193 3450 0
5 male 39.3 20.6 190 3650 0.7
6 female 38.9 17.8 181 3625 0
7 male 39.2 19.6 195 4675 1
8 female 41.1 17.6 182 3200 0
9 male 38.6 21.2 191 3800 0.9
10 male 34.6 21.1 198 4400 0.8
# … with 2 more variables: [,2] <dbl>, ...7 <chr>4 Shiny와 Python 웹앱2
개발과정을 단순화시키기 위해서 관련 모든 개발 파일을 한 디렉토리에 모아둔다. Front-End는 Shiny, Back-End는 scikit-learn 피클 파일로 펭귄 성별 예측모형을 둔다.
[01;34mshiny_python/[00m
├── app.R
├── penguins_cleaned.csv
├── penguins_clf.pkl
└── read_pickle.py
0 directories, 4 files4.1 UI wireframe
최대한 유사하게 UI를 구성하여 이를 Shiny로 작성한다.

4.2 Shiny 웹앱 코드
먼저, reticulate 팩키지를 활용하여 파이썬 코드를 불러읽어 R 환경에서 작업을 할 수 있도록 한다. 그리고 Shiny UI를 개발하고 server에 파이썬 피클 파일을 불러읽어 들여 Front-End에서 입력받은 입력값을 데이터프레임으로 변환시키고 이를 파이썬 객체에 넘겨 펭귄 성별 예측과 확률값을 출력시킨다.
## Packages ----------
library(shiny)
library(tidyverse)
library(reticulate)

## Python Model import -----------------------

reticulate::use_condaenv("miniconda3")

source_python("read_pickle.py")
penguin_clf <- read_pickle_file("penguins_clf.pkl")

## Shiny ----------------

ui <- fluidPage(
  titlePanel("Scikit-learn Palmer Penguins Data"),

  fluidRow(
    column(3,
       sliderInput("bill_length_mm",
                   "bill_length_mm:",
                   min = 32,
                   max = 50,
                   value = 41),
       sliderInput("bill_depth_mm",
                   "bill_depth_mm:",
                   min = 13,
                   max = 22,
                   value = 17),
       sliderInput("flipper_length_mm",
                   "flipper_length_mm:",
                   min = 170,
                   max = 235,
                   value = 200),
       sliderInput("body_mass_g",
                   "body_mass_g:",
                   min = 2700,
                   max = 6300,
                   value = 4200)
    ),
    column(9,
           tags$h2("Penguins Features"),
           tableOutput('penguin_table'),
           tags$h2("Penguins Sex Prediction"),
           verbatimTextOutput("prediction"),
           tags$h2("Penguins Sex Probability"),
           tableOutput('probability_table')
    )
  )
)

server <- function(input, output) {

  ## Dataframe -------------------------------------------------
  penguin_df <- reactive({
    temp_df <- tibble(bill_length = input$bill_length_mm,
                      bill_depth =  input$bill_depth_mm,
                      flipper_length = input$flipper_length_mm,
                      body_mass = input$body_mass_g)
    return(temp_df)
  })


  output$penguin_table <- renderTable(penguin_df())

  ## Prediction -------------------------------------------------
  predictions <- reactive({
      return(py$python_model$predict(t(test_data[1, ])))
  })

  output$prediction <- renderPrint({
    ifelse(penguin_clf$predict(penguin_df()) == 0, "male", "female")
  })

  output$probability_table <- renderTable({
    prob_df <- penguin_clf$predict_proba( penguin_df() )
    prob_df %>%
      as_tibble() %>%
      set_names(c("male", "female"))
  })

}

# Run the application
shinyApp(ui = ui, server = server)
4.3 실행결과

데이터 과학자 이광춘 저작
kwangchun.lee.7@gmail.com