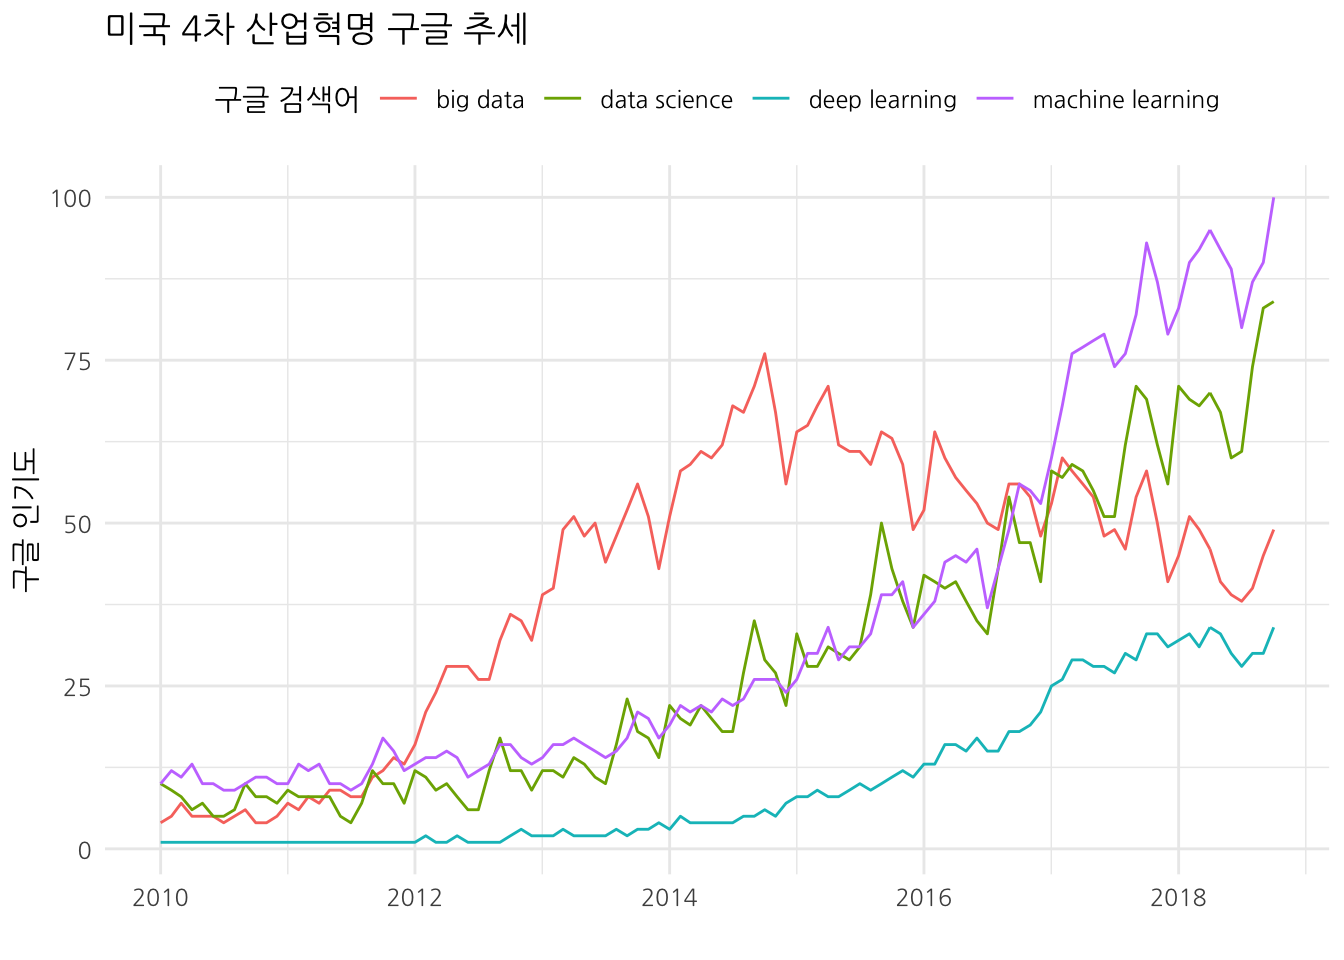
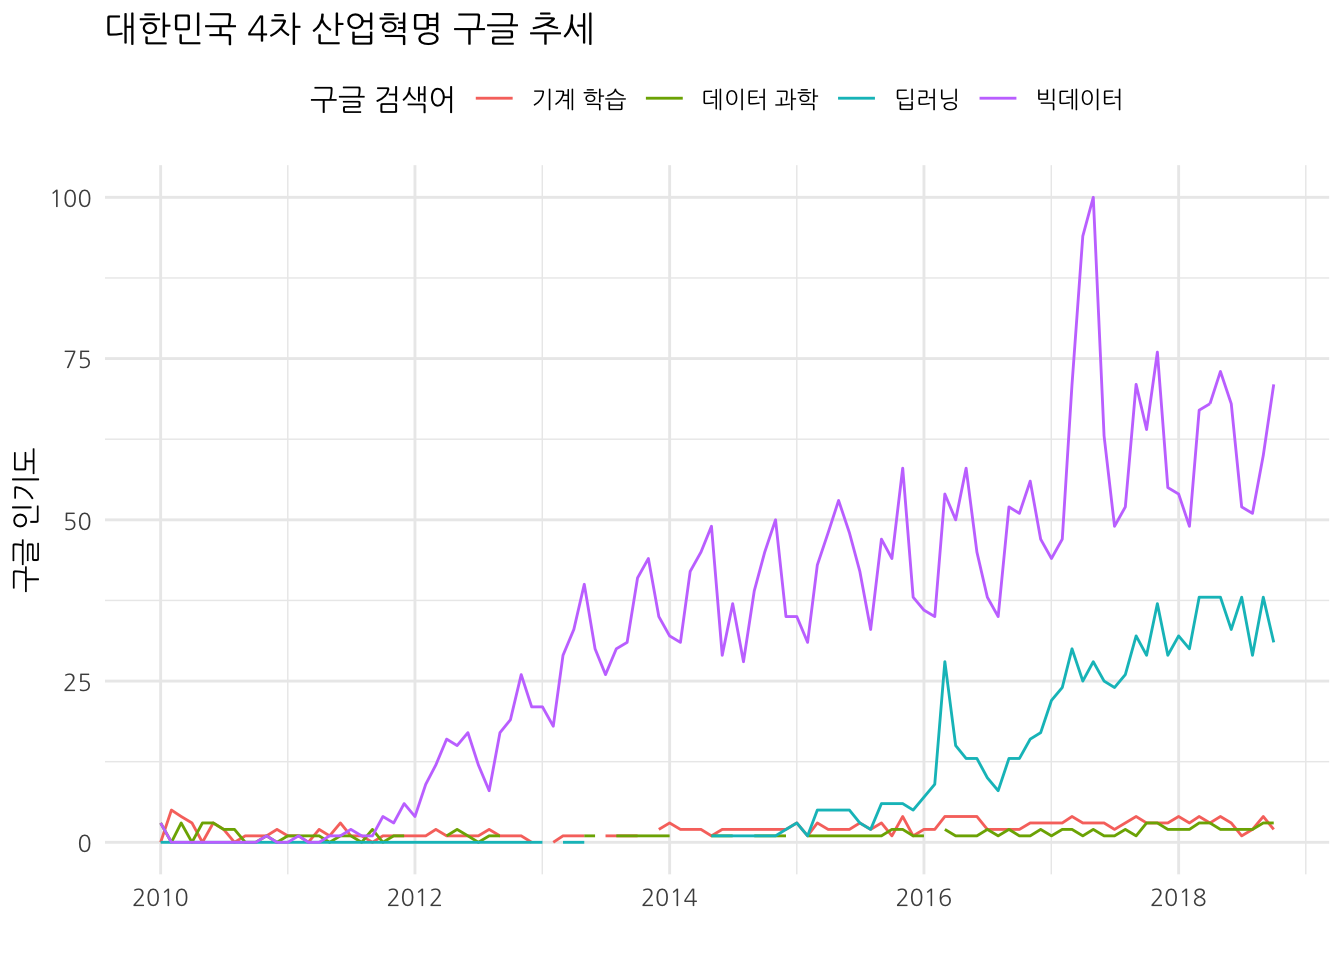
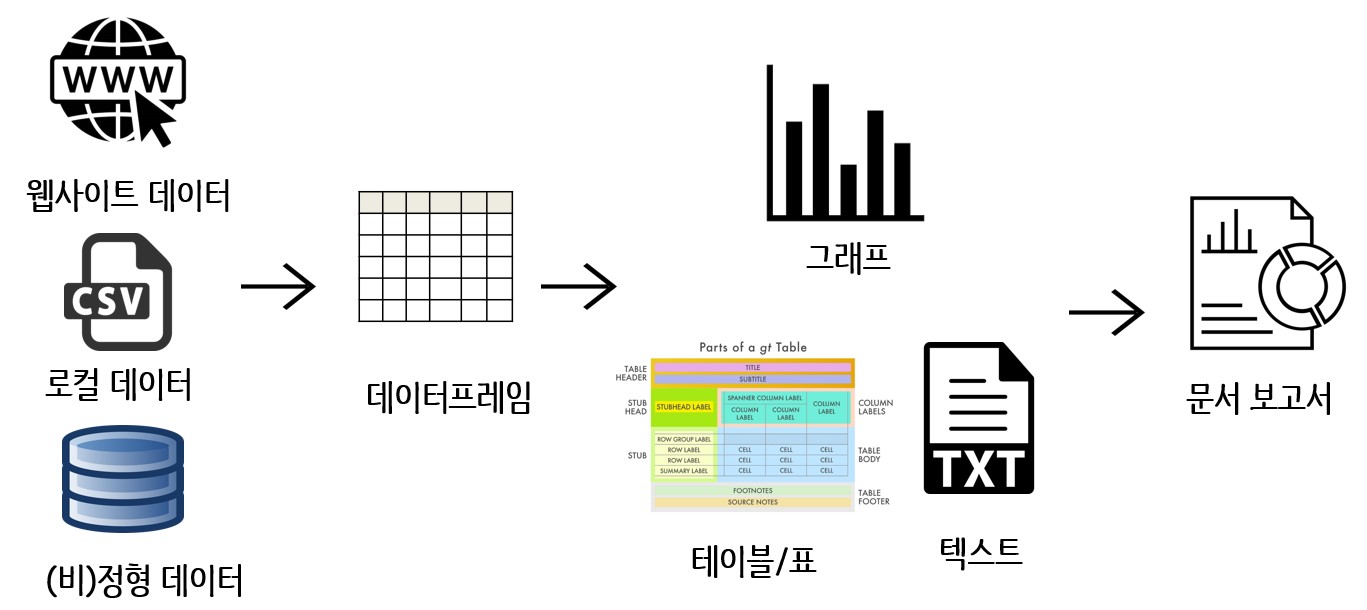
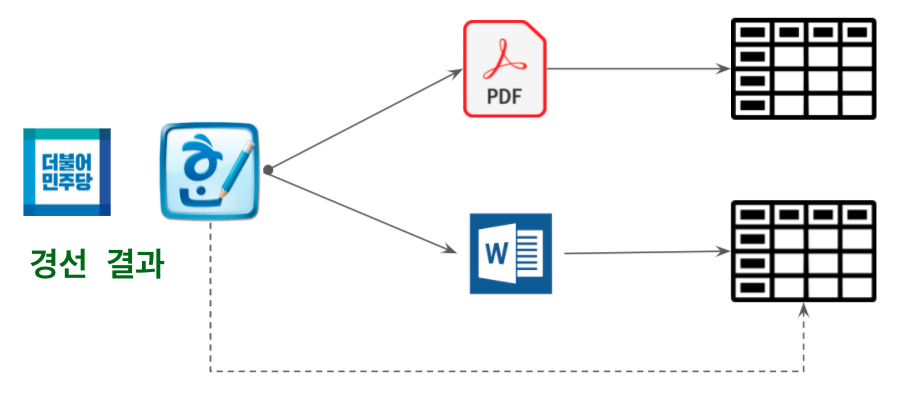
class: title-slide, left, bottom # Tidyverse Meets Shiny ---- ## **보고서에서 제품으로 ... `flexdashboard`, `crosstalk`, `shiny`** ### 이광춘 / 한국 R 사용자회 ### 2022-07-09 --- class: inverse, middle name: skk-tidyverse # 발표 개요 ---- .pull-left[ 과거 R은 통계 언어로 알려졌지만, `ggplot`과 `dplyr` 패키지로 대표되는 `tidyverse`가 2015년 중반 나타나면서 **.warmyellow[데이터 과학 언어]**로 탈바꿈하였다. 이번 Seoul R Meetup 워크샵을 통해 선거 데이터를 통해 전통적인 `ggplot`을 통해 시각화 방법과 서버없이 인터랙티브 시각화 방법을 `crosstalk` 패키지를 활용한 대쉬보드 제작 사례를 소개한다. 마지막으로 `shiny`를 통한 오픈 통계 패키지와 오픈 통계 교과서 제작에 여정을 함께 합니다. ] .pull-right[ .left[ 1\. [`tidyverse`](#skk-tidyverse) 2\. [Rmarkdown to Dashboard - `flexdashboard`](#skk-flexdashboard) 3\. [인터랙티브 대쉬보드 - `crosstalk`](#skk-crosstalk) 4\. [오픈 통계 교과서/패키지 - `shiny`](#skk-shiny) ] ] <!--end of right-column--> <!-------------------------- 1. Tidyverse -----------------------------------------> --- name: skk-tidyverse-toc # 데이터 과학 데이터 사이언스(Data Science)는 데이터를 다루는 과학이다. 따라서 자연법칙을 다루는 자연과학과 맥이 닿아있다. 자연법칙을 측정하여 데이터프레임(`DataFrame`)으로 나타내면 **변수(Variable)**, **관측점(Observation)**, **값(Value)**으로 표현된다. <img src="fig/data-science-overview.png" alt="데이터 사이언스 개요" width="100%" /> .footnote[ [Google Search - "데이터 과학"](https://www.google.com/search?q=%EB%8D%B0%EC%9D%B4%ED%84%B0+%EA%B3%BC%ED%95%99) ] --- name: tidyverse # AI/ML/DL vs 데이터 과학 <br> .center[ <img src="fig/tidyvese_os.png" width="77%" /> ] .footnote[ [한국통계학회 소식지 2019년 10월호 ](https://statkclee.github.io/ds-authoring/ds-stat-tidyverse.html) ] --- name: tidyverse-definition # `tidyverse` <br> .center[ <img src="fig/maso_tidyverse.png" width="77%" /> ] .pull-left[ - 기존 자료구조를 재사용 - 파이프 연산자로 간단한 함수를 조합 - 함수형 프로그래밍을 적극 사용 - 기계가 아닌 인간을 위한 설계 ] .pull-right[ - Reuse existing data structures. - Compose simple functions with the pipe. - Embrace functional programming. - Design for humans. ] --- name: data-science-graph ## Big Data/AI/ML/Data Science <br> .pull-left[ ### Google Trends: 미국  ] .pull-right[ ### Google Trends: 대한민국  ] .footnote[ [이광춘 (2020-07-21), "기업운영혁신을 위한 데이터 과학: 기업의 활용방안", 포항산업과학연구원(RIST)](https://statkclee.github.io/ds-authoring/ds-rist.html) ] <!-------------------------- 2. 대쉬보드 -----------------------------------------> --- class: inverse, middle name: skk-flexdashboard # 발표 개요 ---- .pull-left[ 과거 R은 통계 언어로 알려졌지만, `ggplot`과 `dplyr` 패키지로 대표되는 `tidyverse`가 2015년 중반 나타나면서 **.warmyellow[데이터 과학 언어]**로 탈바꿈하였다. 이번 Seoul R Meetup 워크샵을 통해 선거 데이터를 통해 전통적인 `ggplot`을 통해 시각화 방법과 서버없이 인터랙티브 시각화 방법을 `crosstalk` 패키지를 활용한 대쉬보드 제작 사례를 소개한다. 마지막으로 `shiny`를 통한 오픈 통계 패키지와 오픈 통계 교과서 제작에 여정을 함께 합니다. ] .pull-right[ .left[ 1\. [`tidyverse`](#skk-tidyverse) 2\. **[.warmyellow[Rmarkdown to Dashboard - `flexdashboard`]](#skk-flexdashboard)** 3\. [인터랙티브 대쉬보드 - `crosstalk`](#skk-crosstalk) 4\. [오픈 통계 교과서/패키지 - `shiny`](#skk-shiny) ] ] <!--end of right-column--> --- name: skk-document-eng # 증거기반 문서 제작 개요 <br> .center[  ] --- name: skk-minju-rally # 사례: 민주당 대통령 후보 경선 <br> .center[  ] .footnote[ - [이광춘, "대통령 선거 2022년 - 민주당 경선"](https://aispiration.com/president/president-minju-race.html) ] --- name: skk-minju-flexdashboard # 정적 대쉬보드 <iframe src="https://aispiration.com/president/minj_dashboard.html" width="100%" height="400px" data-external="1"></iframe> .footnote[ - [이광춘, "대쉬보드: 대통령 선거 2022년 - 민주당 경선"](https://aispiration.com/president/minj_dashboard.html) - [소스코드](https://github.com/statkclee/president/blob/master/minj_dashboard.Rmd) ] <!------------------------ 3. 인터랙티브 대쉬보드 -------------------------------------> --- class: inverse, middle name: skk-crosstalk # 발표 개요 ---- .pull-left[ 과거 R은 통계 언어로 알려졌지만, `ggplot`과 `dplyr` 패키지로 대표되는 `tidyverse`가 2015년 중반 나타나면서 **.warmyellow[데이터 과학 언어]**로 탈바꿈하였다. 이번 Seoul R Meetup 워크샵을 통해 선거 데이터를 통해 전통적인 `ggplot`을 통해 시각화 방법과 서버없이 인터랙티브 시각화 방법을 `crosstalk` 패키지를 활용한 대쉬보드 제작 사례를 소개한다. 마지막으로 `shiny`를 통한 오픈 통계 패키지와 오픈 통계 교과서 제작에 여정을 함께 합니다. ] .pull-right[ .left[ 1\. [`tidyverse`](#skk-tidyverse) 2\. [Rmarkdown to Dashboard - `flexdashboard`](#skk-flexdashboard) 3\. **[.warmyellow[인터랙티브 대쉬보드 - `crosstalk`]](#skk-crosstalk)** 4\. [오픈 통계 교과서/패키지 - `shiny`](#skk-shiny) ] ] <!--end of right-column--> --- name: skk-shining-without-shiny # 서버없는 인터랙티브 시각화 - crosstalk <br> .center[  ] .footnote[ - [Crosstalk is an add-on to the htmlwidgets package](https://rstudio.github.io/crosstalk/) ] --- name: skk-crosstalk-gg # 지방선거(경기지사) <iframe src="https://aispiration.com/president/gg-dashboard.html" width="100%" height="400px" data-external="1"></iframe> .footnote[ - [이광춘, "제8회 지방선거 - 경기지사"](https://aispiration.com/president/gg-dashboard.html) ] <!------------------------ 4. 오픈 통계 교과서 -------------------------------------> --- class: inverse, middle name: skk-shiny # 발표 개요 ---- .pull-left[ 과거 R은 통계 언어로 알려졌지만, `ggplot`과 `dplyr` 패키지로 대표되는 `tidyverse`가 2015년 중반 나타나면서 **.warmyellow[데이터 과학 언어]**로 탈바꿈하였다. 이번 Seoul R Meetup 워크샵을 통해 선거 데이터를 통해 전통적인 `ggplot`을 통해 시각화 방법과 서버없이 인터랙티브 시각화 방법을 `crosstalk` 패키지를 활용한 대쉬보드 제작 사례를 소개한다. 마지막으로 `shiny`를 통한 오픈 통계 패키지와 오픈 통계 교과서 제작에 여정을 함께 합니다. ] .pull-right[ .left[ 1\. [`tidyverse`](#skk-tidyverse) 2\. [Rmarkdown to Dashboard - `flexdashboard`](#skk-flexdashboard) 3\. [인터랙티브 대쉬보드 - `crosstalk`](#skk-crosstalk) 4\. **[.warmyellow[오픈 통계 교과서/패키지 - `shiny`]](#skk-shiny)** ] ] <!--end of right-column--> --- name: skk-bitstat # 오픈 통계 패키지 <br> .center[ <img src = "fig/bitstat/openStat_demo.gif"> ] .footnote[ - [BitStat - 오픈 통계 패키지](https://github.com/bit2r/BitStat/) ] --- name: skk-adm-textbook # 오픈 통계 교과서 <br> <iframe src="https://rpubs.com/statkclee/shiny" width="100%" height="400px" data-external="1"></iframe> .footnote[ - [오픈 통계 교과서 - Shiny Apps](https://rpubs.com/statkclee/shiny) - [OpenIntro Statistics](https://www.openintro.org/) ] <!------------------------ 5. 마무리 -------------------------------------> --- name: asia-goodbye class: middle, inverse .pull-left[ # **경청해 주셔서 <br>감사합니다.** <br/> ## 한국 R 사용자회 ] .pull-right[ .right[ <img style="border-radius: 100%;" src="fig/korea_R_logo.png" width="300px"/> ] ]