xwMOOC 데이터 제품
시도별 공기품질
1. 시도별 공기질 측정
공기질 측정소 현황은 한국환경공단 Air Korea 홈페이지 통계정보 → 대기환경 연월보에서 대기환경 연보 최신 2016년 다운로드 받으면 구할 수 있다. 다운로드 받은 데이터 중에서 부록05.2016년 시.도별 항목별 오염도 현황.xls 파일을 참조하여 연도별 공기품질 변화를 시계열적으로 파악해보자.
2. 시도별 공기질 측정 정제작업
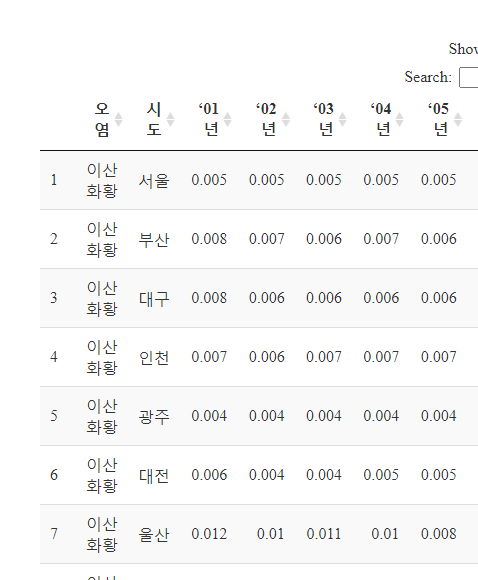
데이터가 대단히 지저분한 엑셀 형태로 되어 있어 이를 깔끔한(tidy) 형태로 가공하는 스크립트를 작성한다. 그리고 시각화 작업에 앞서 DT 표형태로 살펴본다.
# 0. 환경설정 -----
library(tidyverse)
library(readxl)
library(lubridate)
library(extrafont)
loadfonts()
library(ggthemes)
library(crosstalk)
library(plotly)
library(DT)

# 1. 데이터 가져오기 -----
pol_dat <- read_excel("data/air_korea_2016/부록05.2016년 시.도별 항목별 오염도 현황.xls", sheet="부록5", skip = 3)

# 2. 데이터 정제 -----
## 2.1. 데이터 분할 -----

so2_df <- pol_dat %>%
    filter(row_number() <= 19)

no2_df <- pol_dat %>%
    filter(row_number() >= 23,
           row_number() <= 41)

o3_df <- pol_dat %>%
    filter(row_number() >= 45,
           row_number() <= 63)

co_df <- pol_dat %>%
    filter(row_number() >= 67,
           row_number() <= 85)

pm10_df <- pol_dat %>%
    filter(row_number() >= 90,
           row_number() <= 108)

pm25_df <- pol_dat %>%
    filter(row_number() >= 114,
           row_number() <= 132)

## 2.2. 데이터 깔끔하게 -----
so2_df <- so2_df %>%
    filter(연도 !="세종") %>%
    mutate_at(vars(`‘01년`:`'16년`), as.numeric) %>%
    rename(시도 = "연도") %>%
    filter(!시도 %in% c("전국", "수도권")) %>%
    mutate(오염 = "이산화황")

no2_df <- no2_df %>%
    filter(연도 !="세종") %>%
    mutate_at(vars(`‘01년`:`'16년`), as.numeric) %>%
    rename(시도 = "연도") %>%
    filter(!시도 %in% c("전국", "수도권")) %>%
    mutate(오염 = "이산화질소")

o3_df <- o3_df %>%
    filter(연도 !="세종") %>%
    mutate_at(vars(`‘01년`:`'16년`), as.numeric) %>%
    rename(시도 = "연도") %>%
    filter(!시도 %in% c("전국", "수도권")) %>%
    mutate(오염 = "오존")

co_df <- co_df %>%
    filter(연도 !="세종") %>%
    mutate_at(vars(`‘01년`:`'16년`), as.numeric) %>%
    rename(시도 = "연도") %>%
    filter(!시도 %in% c("전국", "수도권")) %>%
    mutate(오염 = "일산화질소")

pm10_all_df <- pm10_df %>%
    filter(연도 !="세종") %>%
    rename(시도 = "연도") %>%
    gather(연도, 값, -시도) %>%
    separate(값, into=c("전부", "황사"), sep = "\\(") %>%
    mutate(황사 = str_replace(황사, "\\)", "")) %>%
    select(시도, 연도, 전부) %>%
    spread(연도, 전부)

pm10_all_df <- pm10_all_df %>%
    mutate(오염 = "미세먼지(PM10)") %>%
    filter(!시도 %in% c("전국", "수도권")) %>%
    mutate_at(vars( `'15년`:`‘13년`), as.numeric)


pm25_all_df <- pm25_df %>%
    filter(연도 !="세종") %>%
    rename(시도 = "연도") %>%
    gather(연도, 값, -시도) %>%
    separate(값, into=c("전부", "황사"), sep = "\\(") %>%
    mutate(황사 = str_replace(황사, "\\)", "")) %>%
    select(시도, 연도, 전부) %>%
    spread(연도, 전부)

pm25_all_df <- pm25_all_df %>%
    mutate(오염 = "미세먼지25") %>%
    filter(!시도 %in% c("전국", "수도권")) %>%
    mutate_at(vars( `'15년`:`‘13년`), as.numeric)

## 2.3. 데이터 병합 -----

pol_df <- bind_rows(so2_df, no2_df) %>%
    bind_rows(o3_df) %>%
    bind_rows(co_df)

pol_df <- rbind(pol_df, pm10_all_df[, names(pol_df)])
pol_df <- rbind(pol_df, pm25_all_df[, names(pol_df)])


pol_df %>%
    select(오염, 시도, everything()) %>%
DT::datatable() 
pol_df <- pol_df %>%
    gather(연도, 값, -오염, -시도) %>%
    mutate(값 = as.numeric(값)) %>%
    group_by(시도, 오염) %>%
    mutate(값 = ifelse(is.na(값), mean(값, na.rm=TRUE), 값)) %>%
    unite("시도오염", c("시도", "오염")) %>%
    spread(연도, 값) %>%
    separate("시도오염", into=c("시도", "오염"))
3. 시도별 공기질 시각화
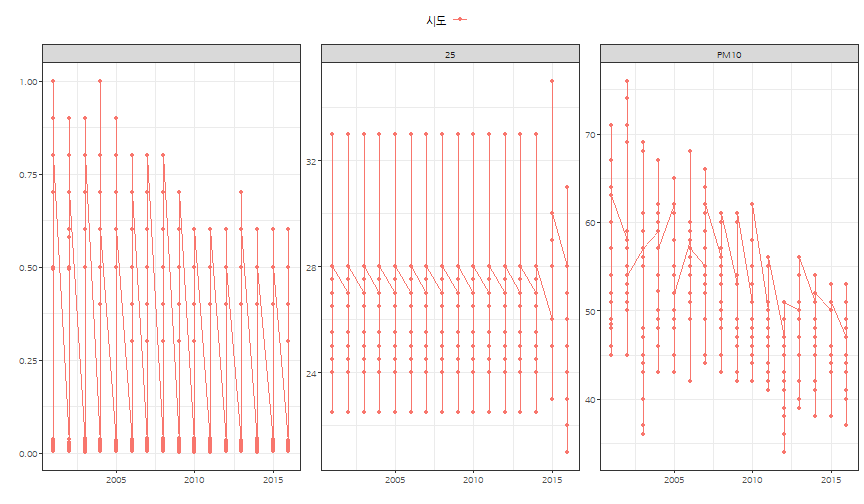
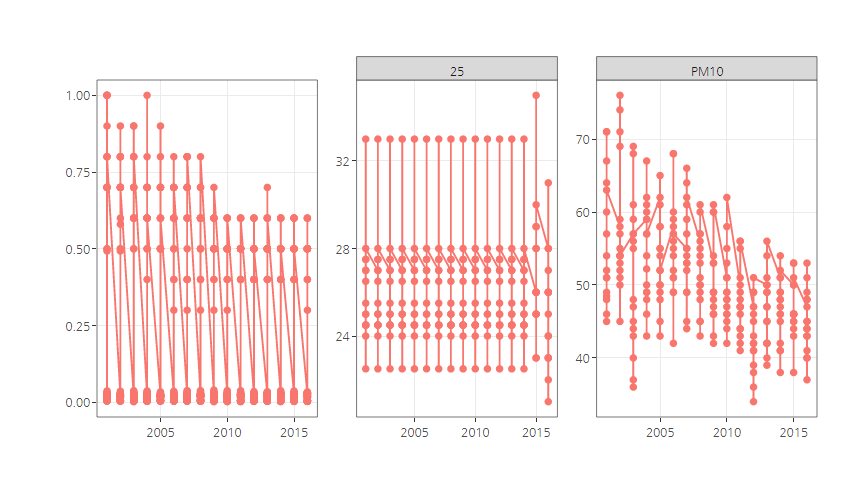
ggplot과 crosstalk를 활용하여 공기품질 시도별, 연도별 변화 추세를 시각화한다.
3.1. 시도별 공기질 정적 시각화
시도별 공기질 정적 시각화를 ggplot으로 수행한다. 앞서 결측값 보정을 위해서 작업을 했는데 최미세먼지(PM25)는 원래 결측값으로 보정한다.
# 3. 추가 데이터 정제 -----
pol_df <- pol_df %>%
    gather(연도, 값, -시도, -오염) %>%
    mutate(연도 = make_date(year = paste0("20",str_extract(연도, "[0-9]+")))) %>%
    mutate(값 = ifelse(오염 == "미세먼지25" & 연도 <= "2013-01-01", NA, 값))

## 3.1. 정적 데이터 시각화 -----
ggplot(pol_df, aes(x=연도, y=값, color=시도, group=시도)) +
    geom_point() +
    geom_line() +
    facet_wrap(~오염, scale="free") +
    labs(x="", y="") +
    theme_bw(base_family="NanumGothic") +
    theme(legend.position = "top") +
    guides(colour = guide_legend(nrow = 1))
3.2. 시도별 공기질 인터랙티브 시각화
시도별 공기품질 인터랙티브 시각화를 작업을 하여 시도별 연도별 비교를 한다. 초미세먼지(PM25) 경기도와 강원도가 3년치 데이터가 동일하여 일부 그래프가 겹쳐보이기도 한다.
# 4. 공기오염 인터랙티브 -----
## 4.1. 공유 데이터

pol_sd <- SharedData$new(pol_df)

## 4.2. 제어
filter_checkbox("시도", "시도", pol_sd, ~시도, inline = TRUE)## 4.3. 시각화
pol_g <- ggplot(pol_sd, aes(x=연도, y=값, color=시도, group=시도)) +
geom_point() +
geom_line() +
facet_wrap(~오염, scale="free") +
labs(x="", y="") +
theme_bw(base_family="NanumGothic") +
theme(legend.position = "none")
ggplotly(pol_g)
