xwMOOC 딥러닝
R 신경망
학습 목표
- 이미 전통이 된 신경망에 대해 이해한다.
nnet팩키지를 사용하여 예측 모형을 구축한다.- 예측모형으로 개발하는 신경망을 시각화한다.
garson,lekprofile함수를 사용하여 변수 중요도와 민감도를 추가 분석한다.
1. nnet 신경망 예측 모형 구축
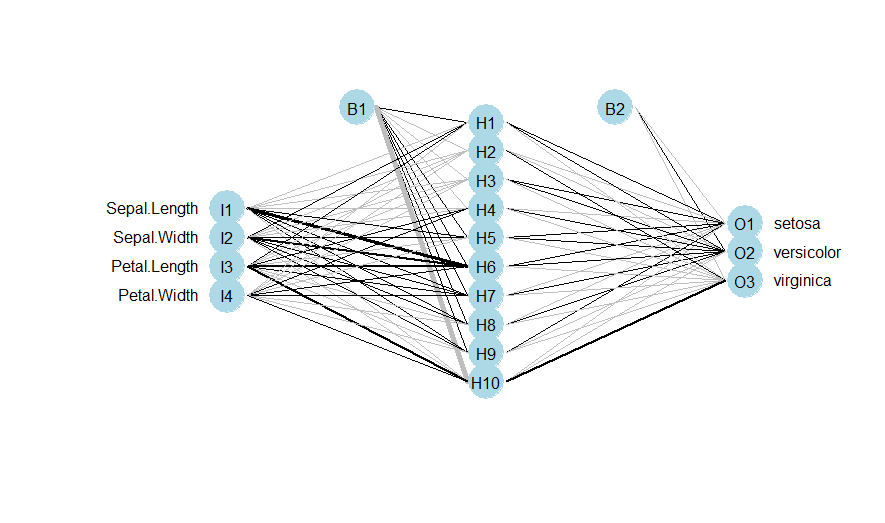
nnet신경망에 종속변수로 입력하기 위해서는class.ind함수로 가변수를 생성하는 과정이 특이하다.sample함수로 150개 붓꽃 데이터를 훈련 데이터 100개, 검증 데이터 50개로 분리한다.nnet함수에 훈련데이터를x,y에 맞춰 집어 넣는다.size는 노드를 10개 설정,softmax로 최종결과 예측
table함수를 통해 검증데이터와 모형결과 정확도를 확인한다.plot.nnet함수를 통해 신경망 모형을 확인한다.
##================================================================
## 01. 환경설정 및 데이터 불러오기
##================================================================
library(nnet)
data(iris)

# nnet 종속변수 입력을 위한 종속변수 변환
species.ind <- class.ind(iris$Species)
iris <- cbind(iris, species.ind)

##================================================================
## 02. 훈련 및 검증 데이터 분리
##================================================================
train.idx  <-  sample(1:150,100)

iris.train.df <- iris[train.idx, ]
iris.test.df <- iris[-train.idx, ]

##================================================================
## 03. 신경망 모형 적합
##================================================================

iris.nn  <-  nnet(x=iris.train.df[,c(1:4)], y=iris.train.df[,c(6:8)], size=10, softmax=TRUE)

##================================================================
## 04. 검증 데이터 예측 및 모형 평가
##================================================================
# 훈련데이터
iris.pred <- predict(iris.nn, iris.train.df[,c(1:4)], type="class")
table(iris.pred, iris.train.df$Species)
# 검증데이터
iris.pred <- predict(iris.nn, iris.test.df[,c(1:4)], type="class")
table(iris.pred, iris.test.df$Species)

##================================================================
## 05. 신경망 시각화
##================================================================
# 시각화 R 코드 함수 다운로드
library(devtools)
source_url('https://gist.githubusercontent.com/fawda123/7471137/raw/466c1474d0a505ff044412703516c34f1a4684a5/nnet_plot_update.r')

# 신경망 모형 시각화
library(reshape2)
plot.nnet(iris.nn)
신경망 모형을 이용한 예측모형 결과값이 훈련데이터를 사용한 신경망 모형에서 오분류가 1건 발생했지만, 검증데이터에는 오분류 없이 예측했다.
> table(iris.pred, iris.train.df$Species)

iris.pred    setosa versicolor virginica
  setosa         35          0         0
  versicolor      0         33         0
  virginica       0          1        31

> table(iris.pred, iris.test.df$Species)

iris.pred    setosa versicolor virginica
  setosa         15          0         0
  versicolor      0         16         0
virginica 0 0 19 
##================================================================
## 06. 신경망 이해
##================================================================
library(NeuralNetTools)
garson(iris.nn)
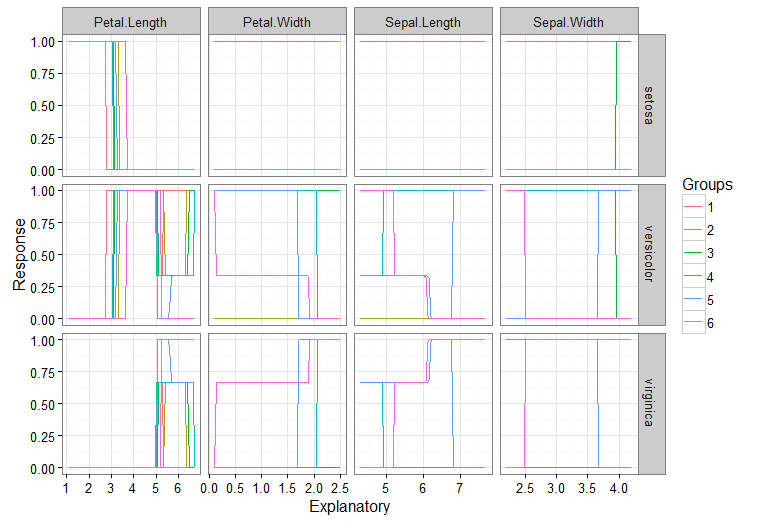
lekprofile(iris.nn)
Garson 알고리즘을 사용한 garson 함수로 변수 중요도를 시각화한다.

Lek 프로파일 방법을 사용하여 lekprofile 함수로 민감도 분석도 가능하다.

참고문헌
- NeuralNetTools: NeuralNetTools 1.0.0 now on CRAN
garson: Garson 알고리즘을 사용하여 변수 중요도를 시각화lekprofile: Lek 프로파일 방법을 사용하여 민감도 분석
- neuralnet : Fitting a neural network in R; neuralnet package
hidden인자로 다층으로 신경망을 구성할 수 있다.
